
Primary question: Can you ship a styled OpenStreetMap print from a single prettymaps.plot() call without touching any GIS tooling?
RepoDaily adoption score
RepoDaily rates this as 90/100 (strong) for adoption: evidence, installation path, production risk, differentiation, license clarity, and AI/agent fit are scored from the article sources and adoption notes.
5 source(s) across 4 source category/categories, plus a RepoDaily-specific evidence module when available.
6 workflow step(s), 6 next-action step(s), and 4 command/install signal(s) were detected.
Trending momentum is +627 stars, with maintenance/release/issue signals counted when present.
Risk is marked low, with 4 security note(s) and 3 explicit skip condition(s).
3 opportunity lens item(s), 4 alternative(s), and 4 type-specific section(s) support differentiation.
License source or license wording is present.
1 AI/agent-related signal(s) were detected in the article text and metadata.
Project overview
prettymaps is a minimal Python library for drawing customized maps from OpenStreetMap data, assembled from four packages the README names explicitly: osmnx, matplotlib, shapely, and vsketch. The entire pitch fits in one line from the docs — prettymaps.plot('Porto Alegre, Brazil') — and that line really is the product: a place-name string in, a stylized city map out. In the trend window ending 2026-08-21 it picked up 627 stars and sits at rank 8, the kind of velocity a screenshot-driven library earns when its output looks like something you would frame.
The learning surface is unusually complete for a project this small. There is a documentation site on GitHub Pages with index, tutorial.md, usage.md, and api.md pages; the README points to a full markdown tutorial covering the Plot dataclass fields, layers and style parameters, presets, multiplot, hillshade, and keypoints. The same tutorial ships as a marimo notebook at notebooks/tutorial.py with a Google Colaboratory copy, and the repo includes a Streamlit front-end launched with streamlit run app.py. A beginner can go from pip install to a GUI without ever writing a loop.
Customization is two dictionaries. A layers dict decides what gets drawn — perimeter, streets (with a width parameter), buildings, water — and a style dict decides how each layer looks, using matplotlib-style fc/ec color keys. prettymaps.plot('Tokyo, Japan', save_as='tokyo_map.png') writes the result to disk, and the docs feature list adds SVG and plotter-friendly export alongside PNG. Presets persist a favorite style across cities, keypoints highlight specific places, and hillshade adds elevation shading for a pseudo-3D effect.
The governance terms deserve equal billing with the features. The project is licensed under GNU AGPL v3.0: the README states you can make commercial use, distribute, and modify it, but you must disclose the source code with the license and copyright notice. Printed figures must keep the credit line for the repository and OpenStreetMap, which the README calls mandatory under the OSM license. The author also states plainly that NFT use is not authorized in any way, naming AeternaCivitas and geoartnft as projects that sold NFTs from this work without credit, and notes that other generative art projects were closed over this behavior.
Why it is trending now
- 627 stars in the trend window and rank 8 on 2026-08-21: poster-grade output is inherently shareable, and every user's render doubles as an advertisement.
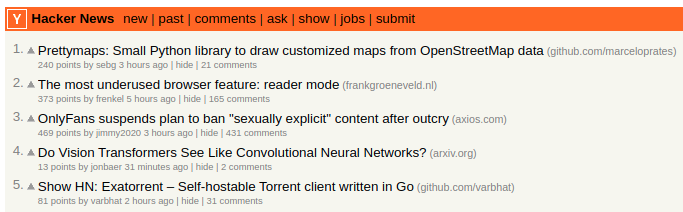
- The README preserves its Hacker News front-page moment and links an r/prettymaps_ subreddit — two durable discovery channels that keep bringing new visitors.
- The distance from pip install prettymaps to a finished image is one function call — no GIS background required.
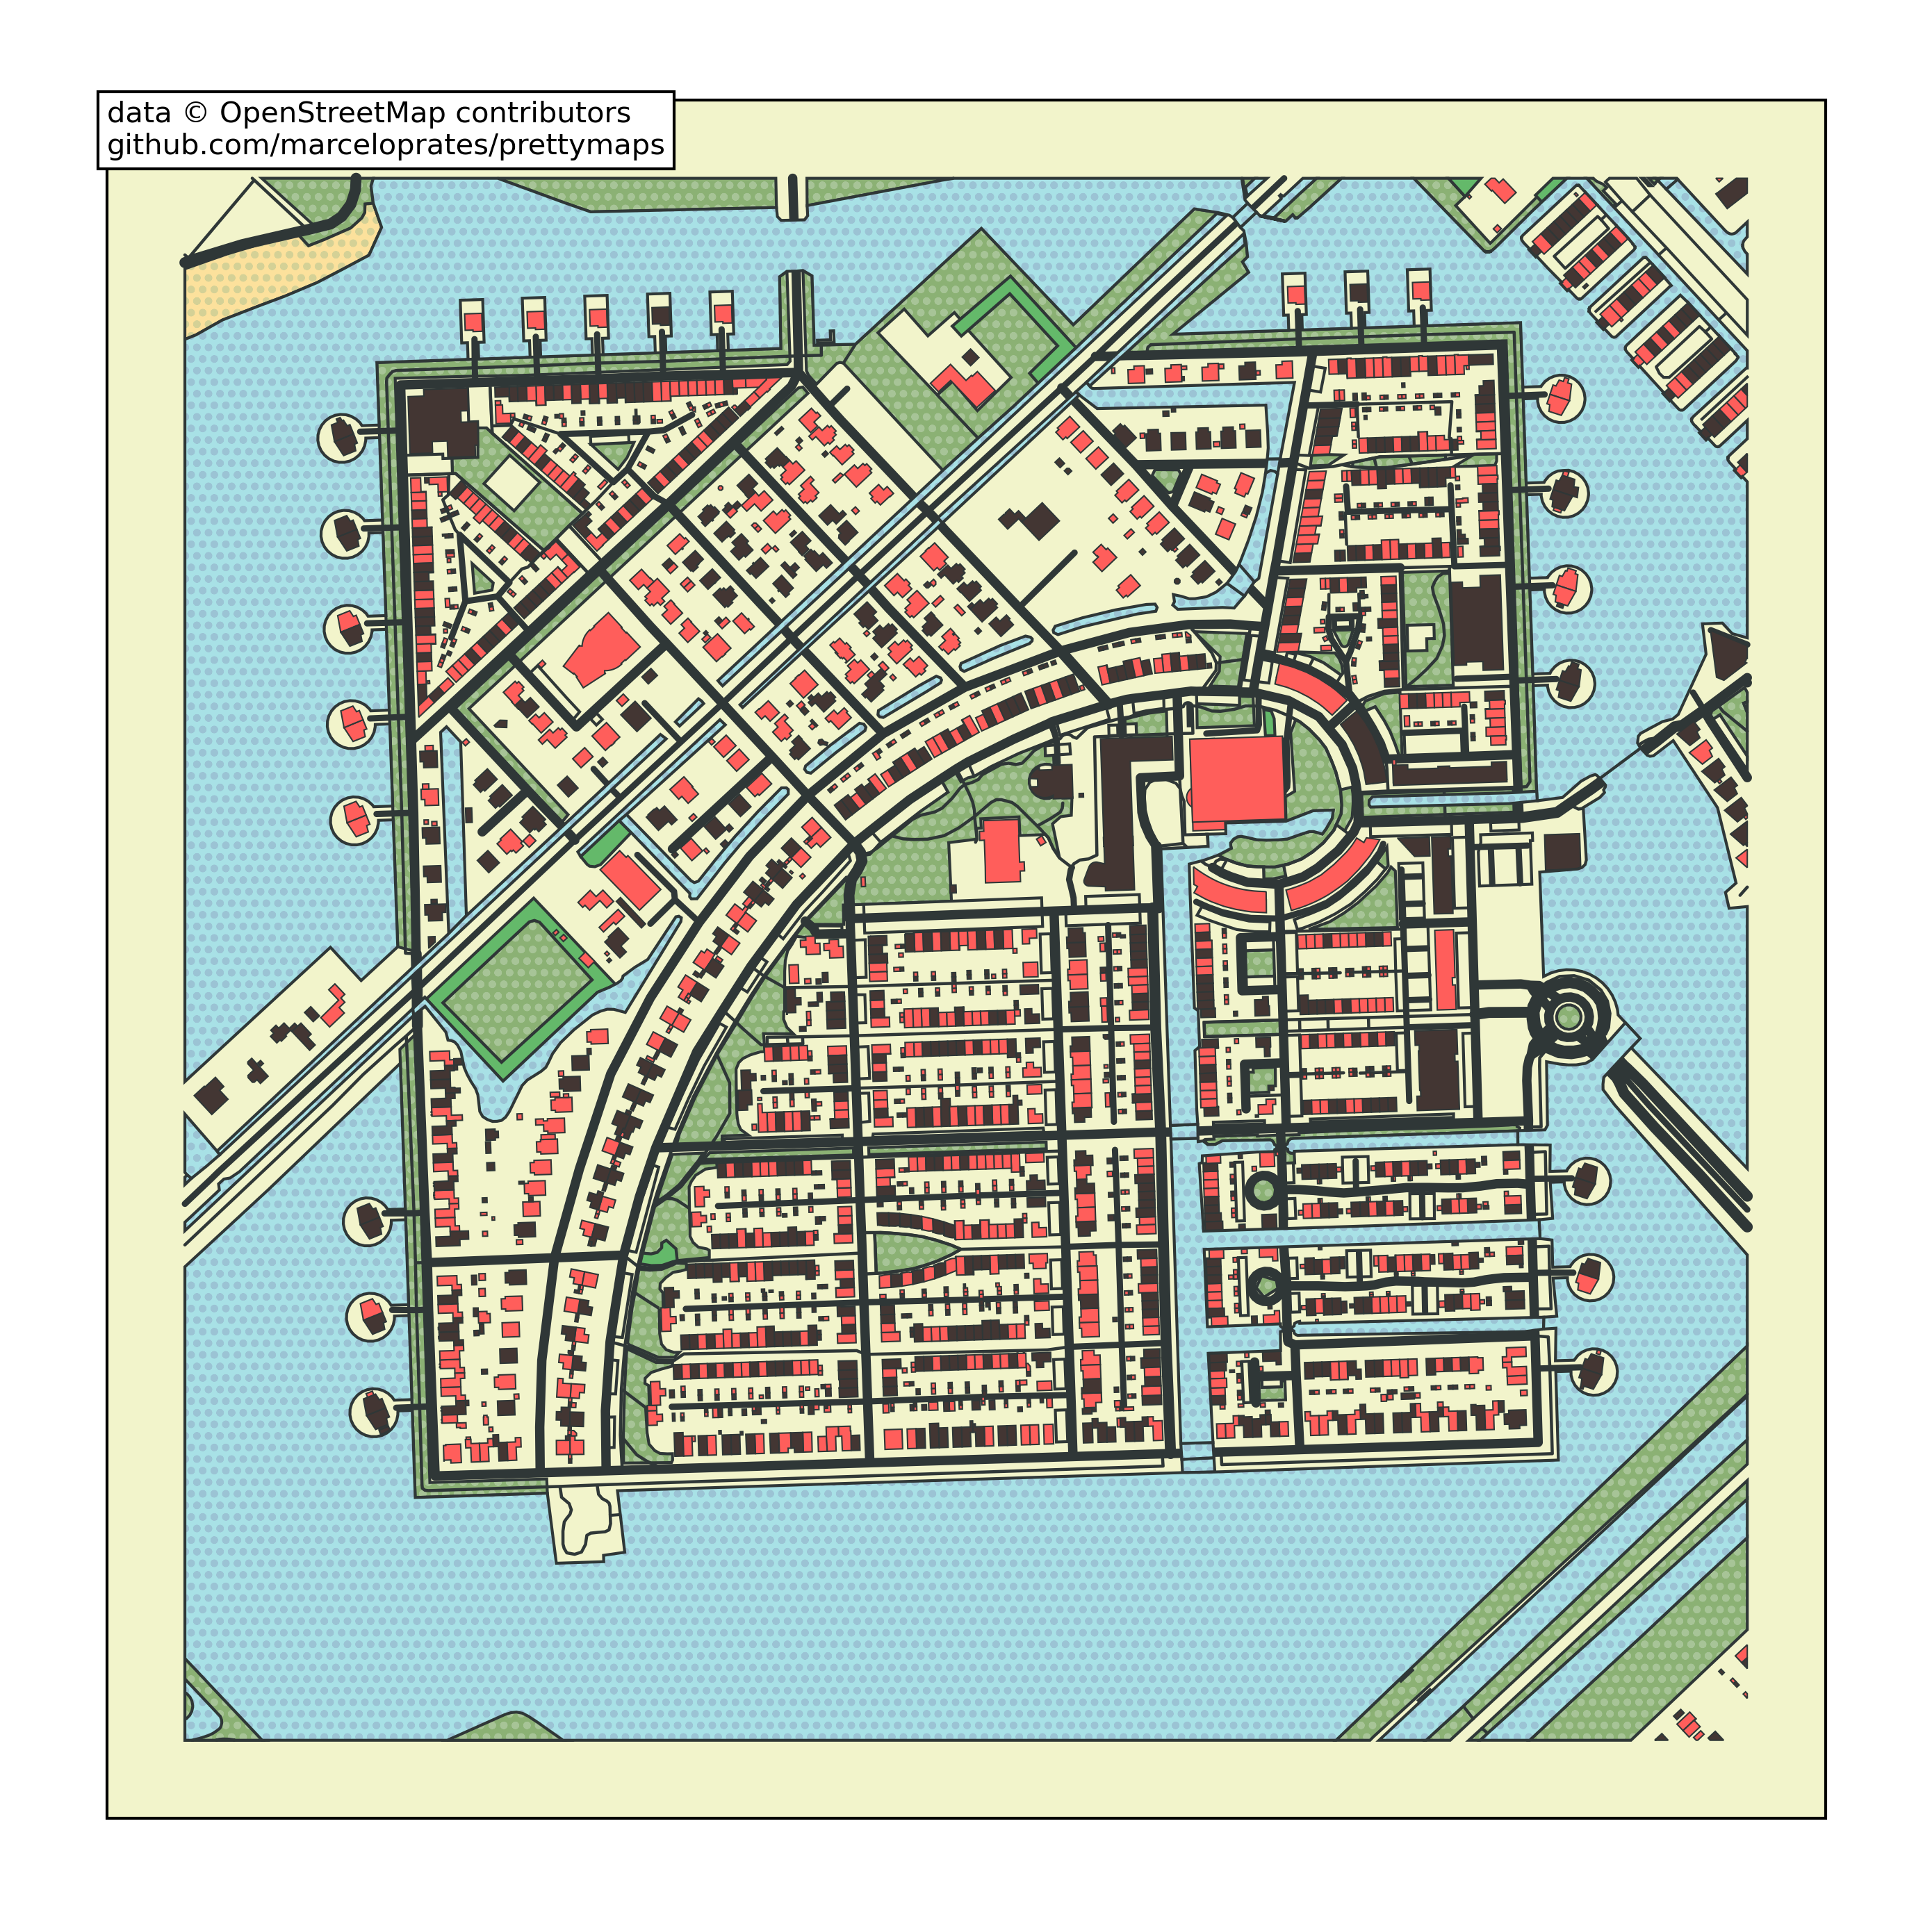
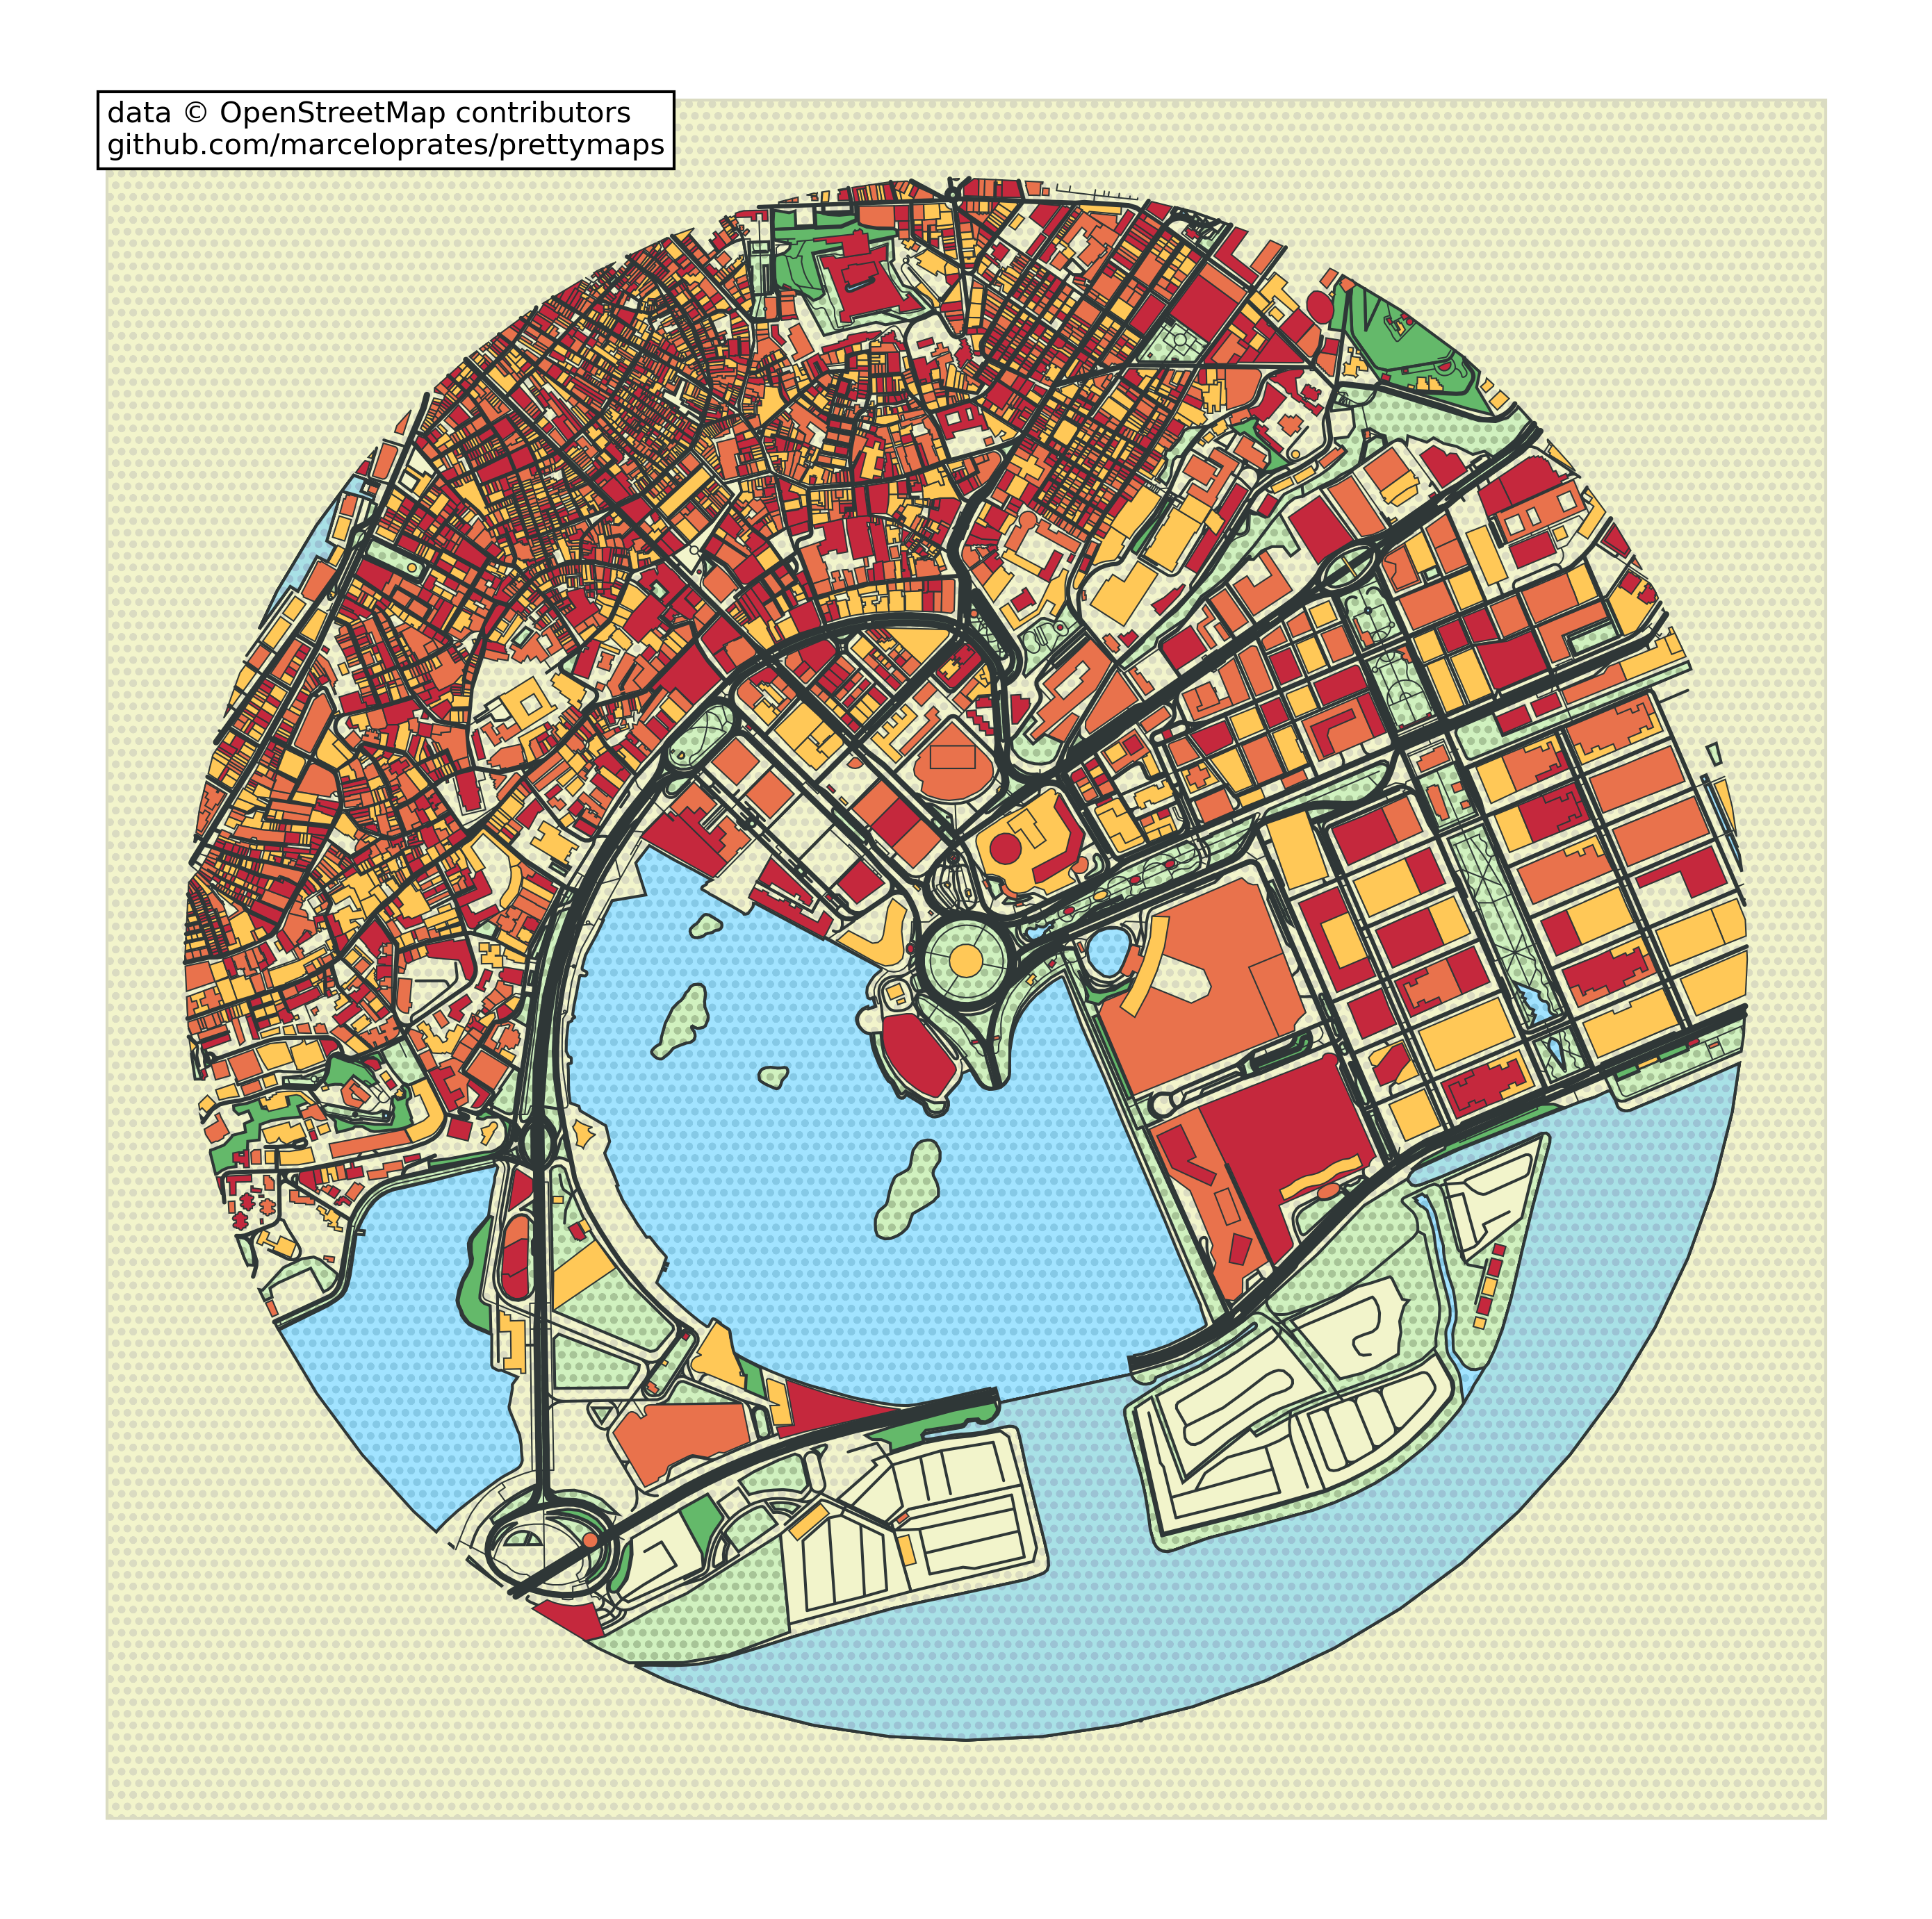
- The tutorial tour pairs Heerhugowaard (default preset) with Macau (custom parameters), showing the ceiling of customization in two pictures.
- A Google Colab demo plus a Streamlit front-end means first-time users can skip local setup entirely.
Problem it solves
- Artistic city maps normally demand either a desktop GIS package with dozens of cartographic settings or manual tracing in a design tool.
- Fetching OpenStreetMap geometry yourself means wrangling osmnx queries, GeoPandas frames, and matplotlib patches for every layer you want to draw.
- Pen-plotter artists need clean vector geometry, not raster screenshots of a web map.
- Reproducing one signature style across many cities by hand does not scale; that reuse is exactly what the preset system automates.
How it works
- Install with pip install prettymaps; the README badge requires Python 3.11+. On Colab use !pip install -e "git+https://github.com/marceloprates/prettymaps#egg=prettymaps" and restart the runtime before importing.
- Draw the quick start: prettymaps.plot('Stad van de Zon, Heerhugowaard, Netherlands') fetches OpenStreetMap features for the query and renders them.
- Customize with the two-dictionary pattern from docs/usage.md: layers={'perimeter': {}, 'streets': {'width': 8}, 'buildings': {}, 'water': {}} and a matching style dict with fc/ec colors.
- Persist results with prettymaps.plot('Tokyo, Japan', save_as='tokyo_map.png'); docs/index.md lists PNG, SVG, and plotter-friendly export.
- Level up through docs/tutorial.md — presets, keypoints, hillshade, multiplot — or skip code entirely with streamlit run app.py.
- Learn end to end via the marimo notebook at notebooks/tutorial.py or its Google Colaboratory copy.
Product demo and interface preview
The 30-Minute Try-It Path
The fastest credible test is three commands taken verbatim from the README. First, pip install prettymaps, noting the README badge requires Python 3.11+. Second, the quick start — import prettymaps; prettymaps.plot('Stad van de Zon, Heerhugowaard, Netherlands') — the same Dutch neighborhood shown in the tutorial's opening image. Third, run streamlit run app.py from the repository to get the front-end instead of the API. On Google Colab the README's install is !pip install -e "git+https://github.com/marceloprates/prettymaps#egg=prettymaps" followed by Runtime -> Restart Runtime before importing prettymaps — the single easiest step to miss.
Then read docs/tutorial.md, which the README describes as the full walkthrough: rendered images, the Plot dataclass fields, the layers and style parameters, presets, multiplot, hillshade, and keypoints. The tour images make the learning progression visible — Heerhugowaard rendered with the default preset, Macau with custom parameters — so you can see exactly what changes when you stop accepting defaults.
Architecture: Four Libraries, One Plot Call
prettymaps is a thin, opinionated layer over four packages the README credits: osmnx for the OpenStreetMap data side, matplotlib for rendering, shapely for geometry, and vsketch for plotter-friendly output. The public API shown in docs/usage.md is small — prettymaps.plot() with a query, layers, style, and save_as — and docs/index.md advertises an api.md reference alongside tutorial.md and usage.md for anything deeper.
That smallness is the pedagogical point. Because the customization contract is two dictionaries, a learner can hold the whole model from one example, then drop down to osmnx and shapely when a project outgrows presets. The docs structure mirrors that path: index for features, tutorial for concepts, usage for copy-paste snippets, api for the full surface.
License and Conduct Terms You Sign Up For
- LICENSE is GNU AGPL v3.0. Commercial use, distribution, and modification are permitted, but modified source must be disclosed with the license and copyright notice — and the AGPL preamble extends disclosure duties to modified versions running on network servers.
- The README asks that printed figures keep the credit to the repository and OpenStreetMap, describing it as mandatory under the OSM license.
- The author explicitly refuses NFT use in any way, names AeternaCivitas and geoartnft as uncredited NFT sellers, and says other generative art projects were closed for this reason.
- Python 3.11+ is required per the README badge, and the Colab install path pulls the repository directly, so pin or review the commit you execute.
Adoption Checklist
- Confirm your interpreter is Python 3.11+ before installing.
- Pick the output path early: PNG for prints, SVG or plotter-friendly formats for cutting and plotting (docs/index.md feature list).
- If you will sell prints or host anything derived from the code, plan AGPL v3 source disclosure and keep the printed credit line.
- Rule out NFT use completely — the author forbids it.
- Onboard newcomers through notebooks/tutorial.py or the Colab demo rather than the API reference.
Who should pay attention?
Good fit if
- Pen-plotter and generative-art hobbyists who want real-city geometry in vector form.
- Python learners moving past toy examples into a library with a tiny API and immediate visual payoff.
- Designers producing personalized city prints — neighborhoods, weddings, hometowns — without GIS tooling.
- Educators demonstrating OpenStreetMap data with a one-line result students can export and keep.
Skip for now if
- Anyone planning NFT sales: the author states the project is not authorized for NFT use in any way.
- Hosted services unwilling to release AGPL v3 source for modified versions.
- Analysts needing routing, isochrones, or spatial statistics — prettymaps draws maps; osmnx does the analysis.
Risks and cautions
For personal art, teaching, and one-off prints the risk is low — a client-side drawing library with no accounts or secrets, whose inputs are place-name strings. The constraints that matter are legal rather than technical: AGPL v3 disclosure duties, the mandatory credit line, and the author's NFT prohibition.
- No authentication surface, stored credentials, or telemetry appear anywhere in the README or docs.
- AGPL v3 requires disclosing modified source when you distribute or publicly host a derivative.
- Printed output must retain credit to the repository and OpenStreetMap.
- NFT use is explicitly refused by the author, regardless of credit.
- Map data is fetched over the network through osmnx; the inputs are location strings, not credentials.
- The Colab install command installs straight from the GitHub repository (git+https), so pin or audit the commit if supply-chain provenance matters.
- Nothing in the README or docs describes accounts, secrets, or telemetry.
- The main audit item is license compliance: AGPL v3 text and copyright notice must accompany derivatives.
Alternatives to compare
| Approach | When to use | Trade-off |
|---|---|---|
osmnx | You need to fetch and analyze OpenStreetMap graphs and geometries yourself rather than draw finished posters | Free, open source |
vsketch | Your target is a pen plotter and you want a generative-sketch framework rather than map-specific presets | Free, open source |
QGIS | You need full desktop cartography: projections, label engines, and print layouts | Free, open source |
Folium | You want interactive Leaflet web maps inside a Python notebook instead of static posters | Free, open source |
What this trend reveals
A First Geodata Lesson With a Printable Payoff
Because prettymaps.plot() turns a place-name string into a finished figure, a first lesson can end with something framable before students ever meet coordinates or projections; docs/tutorial.md then sequences the concepts through the Plot dataclass fields.
Run the Colab demo with five beginners and record whether each one exports a PNG within 15 minutes.
A Preset-Driven City Poster Line
Presets persist a style and export covers PNG, SVG, and plotter-friendly formats, so one look can be re-run across many cities. AGPL v3 explicitly permits commercial use as long as source is disclosed and credits are kept.
Produce three posters from a single preset, then compare your unit cost and price against comparable city-map prints already on sale.
A GUI Kiosk for Events
streamlit run app.py launches a front-end shipped in the repository, which suggests a local kiosk where guests type their own address and leave with a print.
Run app.py for one hour at an event and log every crash, slow query, or confusing input.
RepoDaily verdict
prettymaps is the rare library whose screenshot and whose quick start are the same artifact: one plot() call, a real place, a framable map. As an on-ramp to geospatial Python it is unusually well-lit — a sequenced tutorial, presets, a Colab notebook, and a GUI — and the only serious friction is legal rather than technical: AGPL v3 disclosure, printed credits, and a hard no on NFTs.